- Home


Quadratic Functions: Parabolas
Definitions: Quadratic functions:
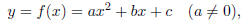
where a, b, c are real numbers.
The Graph of a Quadratic Function
* Shape: parabola, symmetric
When a > 0
When a < 0
* Vertex:
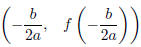
 is
the optimum value (either maximum or minimum) of the function.
is
the optimum value (either maximum or minimum) of the function.
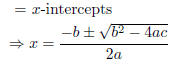
* Zeros of quadratic functions = Solutions of the quadratic equation ax2 + bx + c = 0
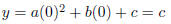
* y-intercept = y value when x = 0
Ex.1 (#6) f(x) = x2 + 2x - 3
(a) The vertex
(b) Is the vertex a maximum or minimum point?
(c) x value for the optimal value
(d) The optimal value
(e) Zeros
(f) y-intercept
(g) Graph
Ex.2 (# 36) If 100 feet of fence is used to enclose a rectangular yard,
determine the length and width of
the rectangle that give maximum area.
Shifting Graphs
Compare vertices.
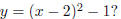
Ex.3 How is the graph of y = x2 shifted to get the graph of
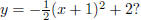
Ex.4 How is the graph of
 shifted
to get the graph of
shifted
to get the graph of
Average Rate of Change
The rate of change of a quadratic function is not constant.
-> use the average rate of change between two points.
Definition: The average rate of change of f(x) between two points x = a and x = b (a < b) is
Average rate of change
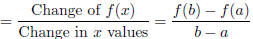
= Slope of the line between (a, f(a)) and (b, f(b))
Ex.5 (#42) The figure (on p.160) shows the graph of a total revenue function,
with x equal to the
number of units sold.
(a) Is the average rate of change of revenue negative from x = a to x = b or
from x = b to x = c?
Explain.
(b) Would the number of units d need to satisfy d < b or d > b for the
average rate of change of
revenue from x = a to x = d to be greater than that from x = a to x = b?
Explain.